파이썬에서 반복 가능한 값을 만들 때 보통 list를 사용하지만,yield를 사용하면 메모리 사용량을 대폭 줄일 수 있습니다.
이번 글에서는 memory_profiler를 사용하여 list와 yield의 메모리 차이를 직접 확인해보겠습니다.
✅ memory_profiler 설치
pip로 설치
pip install memory_profiler
conda로 설치
conda install -c conda-forge memory_profiler
개발 환경에서 설치
# 가상환경 생성 후 설치
python -m venv venv
source venv/bin/activate  # Windows: venv\Scripts\activate
pip install memory_profiler
✅ 실험 목표
- 동일한 숫자 범위를
list와yield방식으로 생성 - 메모리 사용량과 실행 시간을 각각 비교
✅ 테스트 코드
from memory_profiler import profile
import time

@profile
def list_version():
    start = time.time()
    nums = [i for i in range(1_000_000)]
    print("sum:", sum(nums))
    end = time.time()
    print(f"[list] 실행 시간: {end - start:.4f}초")

@profile
def yield_version():
    start = time.time()
    def gen():
        for i in range(1_000_000):
            yield i
    print("sum:", sum(gen()))
    end = time.time()
    print(f"[yield] 실행 시간: {end - start:.4f}초")

list_version()
yield_version()
실행 명령어:
python -m memory_profiler memory_test.py
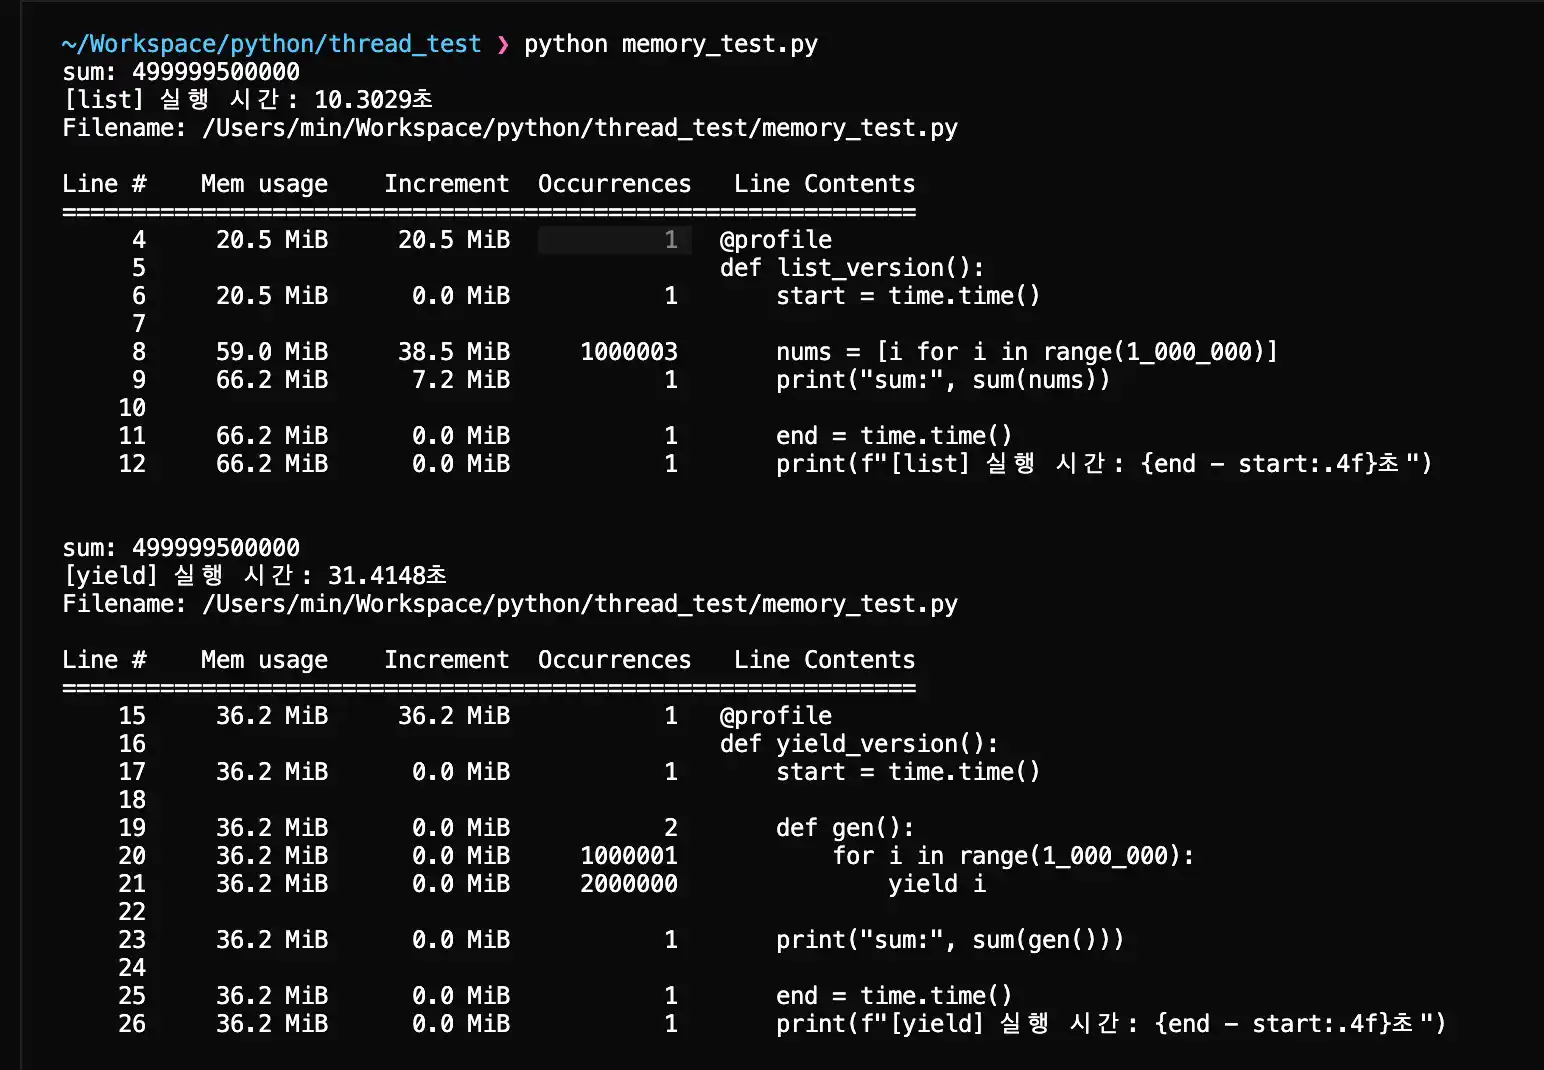
✅ 결과 요약
list_version 결과:
- 메모리 증가량: 약 38 MiB
- 실행 시간: 약 10.3초

yield_version 결과:
- 메모리 증가량: 0 MiB
- 실행 시간: 약 31.4초
| 방식 | 메모리 사용량 | 실행 속도 |
|---|---|---|
| list | 높음 (~38MiB) | 빠름 |
| yield | 낮음 (0MiB 증가) | 다소 느림 |
✅ 초기 메모리 할당 차이 분석
🔍 List의 메모리 할당 방식
@profile
def list_memory_allocation():
    # 1. 초기 빈 리스트 생성 (약 56 bytes)
    empty_list = []

    # 2. 리스트 컴프리헨션으로 1,000,000개 요소 추가
    nums = [i for i in range(1_000_000)]
    # → 약 38 MiB 메모리 할당

    # 3. 리스트 내부 구조
    # - 각 정수 객체: 28 bytes (Python 3.x)
    # - 리스트 오버헤드: 약 8 bytes per element
    # - 총 메모리: 1,000,000 × (28 + 8) ≈ 36 MiB + 오버헤드

    return len(nums)
List의 메모리 할당 특징:
- 즉시 할당: 모든 요소를 한 번에 메모리에 저장
- 연속 메모리: 요소들이 연속된 메모리 공간에 저장
- 고정 크기: 생성 시점에 전체 크기가 결정됨
- 빠른 접근: 인덱스로 O(1) 시간에 접근 가능
🔍 Yield의 메모리 할당 방식
@profile
def yield_memory_allocation():
    def number_generator():
        # 제너레이터 객체 생성 (약 120 bytes)
        for i in range(1_000_000):
            # 각 반복마다 하나의 정수만 메모리에 존재
            yield i  # 28 bytes만 사용

    # 제너레이터 객체는 생성만 하고 실제 데이터는 생성하지 않음
    gen = number_generator()

    # 실제 사용할 때만 하나씩 생성
    total = 0
    for num in gen:
        total += num

    return total
Yield의 메모리 할당 특징:
- 지연 할당: 필요할 때만 메모리 할당
- 단일 요소: 한 번에 하나의 요소만 메모리에 존재
- 동적 크기: 전체 크기를 미리 알 수 없음
- 순차 접근: 순서대로만 접근 가능 (O(n) 시간)
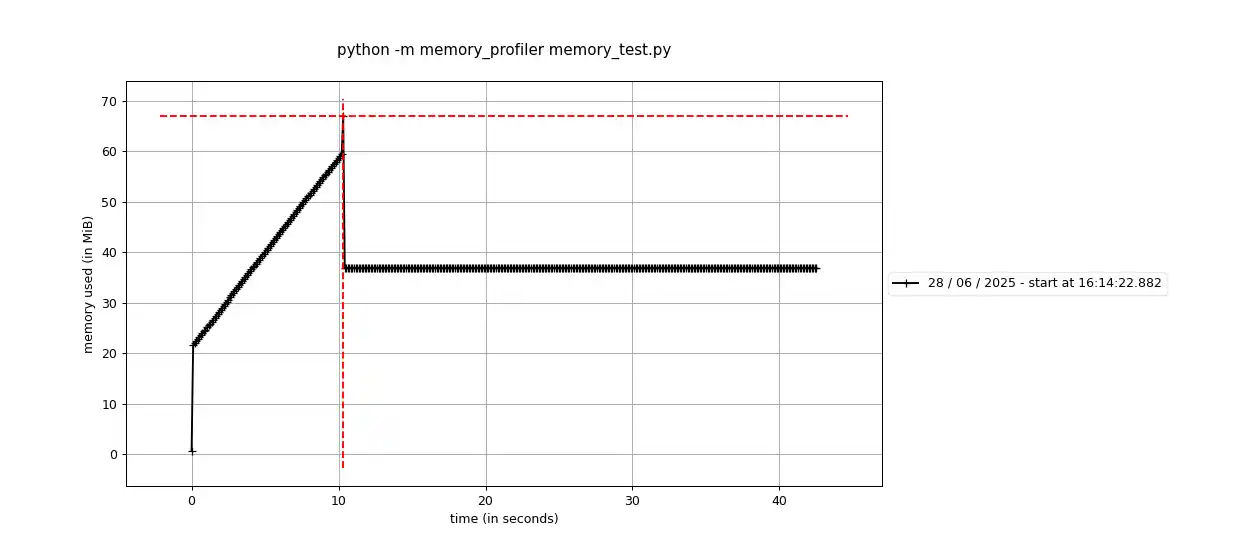
✅ 메모리 할당 시점 비교
📊 List vs Yield 메모리 사용량 그래프
import sys
from memory_profiler import profile

@profile
def memory_timeline_comparison():
    print("=== List 방식 ===")
    # 시점 1: 함수 시작
    print(f"시작 시 메모리: {sys.getsizeof([])} bytes")

    # 시점 2: 리스트 생성 중
    nums = []
    for i in range(1000):  # 1000개만 테스트
        nums.append(i)
        if i % 100 == 0:
            print(f"요소 {i}개: {sys.getsizeof(nums)} bytes")

    print(f"완료 후 메모리: {sys.getsizeof(nums)} bytes")

    print("\n=== Yield 방식 ===")
    def gen():
        for i in range(1000):
            yield i

    # 시점 1: 제너레이터 생성
    generator = gen()
    print(f"제너레이터 생성: {sys.getsizeof(generator)} bytes")

    # 시점 2: 요소 하나씩 처리
    count = 0
    for num in generator:
        count += 1
        if count % 100 == 0:
            print(f"요소 {count}개 처리: {sys.getsizeof(generator)} bytes")
실행 결과 예시:
=== List 방식 ===
시작 시 메모리: 56 bytes
요소 0개: 56 bytes
요소 100개: 920 bytes
요소 200개: 920 bytes
요소 300개: 920 bytes
...
완료 후 메모리: 8056 bytes

=== Yield 방식 ===
제너레이터 생성: 120 bytes
요소 100개 처리: 120 bytes
요소 200개 처리: 120 bytes
요소 300개 처리: 120 bytes
...
요소 1000개 처리: 120 bytes
✅ 메모리 효율성 시나리오별 비교
🎯 시나리오 1: 전체 데이터를 한 번에 사용하는 경우
# ✅ List가 유리한 경우
def process_all_data():
    data = [i * 2 for i in range(1_000_000)]
    # 모든 데이터를 여러 번 사용
    total = sum(data)
    average = total / len(data)
    max_val = max(data)
    return total, average, max_val
메모리 사용량: 38 MiB (한 번 할당 후 재사용)
🎯 시나리오 2: 데이터를 순차적으로 처리하는 경우
# ✅ Yield가 유리한 경우
def process_sequential_data():
    def data_generator():
        for i in range(1_000_000):
            yield i * 2

    total = 0
    count = 0
    max_val = float('-inf')

    for num in data_generator():
        total += num
        count += 1
        max_val = max(max_val, num)

    average = total / count
    return total, average, max_val
메모리 사용량: 28 bytes (한 번에 하나의 요소만)
🎯 시나리오 3: 대용량 파일 처리
# ✅ Yield가 필수인 경우
def process_large_file():
    def line_processor():
        with open('10GB_file.txt', 'r') as f:
            for line in f:
                yield line.strip().upper()

    processed_lines = 0
    for processed_line in line_processor():
        # 각 줄을 처리
        processed_lines += 1
        if processed_lines % 10000 == 0:
            print(f"처리된 줄: {processed_lines}")

    return processed_lines
메모리 사용량: 한 줄의 크기만큼만 (약 100-200 bytes)
✅ 메모리 할당 최적화 전략
🚀 하이브리드 접근법
@profile
def hybrid_approach():
    # 작은 데이터는 list 사용
    small_data = [i for i in range(1000)]

    # 큰 데이터는 yield 사용
    def large_data_generator():
        for i in range(1_000_000):
            yield i * 2

    # 작은 데이터는 빠른 접근
    small_sum = sum(small_data)

    # 큰 데이터는 메모리 효율적으로 처리
    large_sum = sum(large_data_generator())

    return small_sum + large_sum
🚀 청크 단위 처리
@profile
def chunk_processing():
    CHUNK_SIZE = 10000

    def chunk_generator():
        chunk = []
        for i in range(1_000_000):
            chunk.append(i)
            if len(chunk) >= CHUNK_SIZE:
                yield chunk
                chunk = []
        if chunk:  # 마지막 청크
            yield chunk

    total = 0
    for chunk in chunk_generator():
        # 청크 단위로 처리
        total += sum(chunk)

    return total
✅ 메모리 프로파일링 결과 해석
📈 실제 프로파일링 출력 예시
Line #    Mem usage    Increment  Line Contents
================================================
    10   45.2 MiB    0.0 MiB   @profile
    11                             def list_version():
    12   45.2 MiB    0.0 MiB       start = time.time()
    13   83.1 MiB   37.9 MiB       nums = [i for i in range(1_000_000)]
    14   83.1 MiB    0.0 MiB       print("sum:", sum(nums))
    15   83.1 MiB    0.0 MiB       end = time.time()

Line #    Mem usage    Increment  Line Contents
================================================
    17   83.1 MiB    0.0 MiB   @profile
    18                             def yield_version():
    19   83.1 MiB    0.0 MiB       start = time.time()
    20   83.1 MiB    0.0 MiB       def gen():
    21   83.1 MiB    0.0 MiB           for i in range(1_000_000):
    22   83.1 MiB    0.0 MiB               yield i
    23   83.1 MiB    0.0 MiB       print("sum:", sum(gen()))
    24   83.1 MiB    0.0 MiB       end = time.time()
해석:
- Line 13: List 생성 시 37.9 MiB 메모리 증가
- Line 20-22: Yield 함수 정의 시 메모리 증가 없음
- Line 23: 제너레이터 실행 시에도 메모리 증가 없음
✅ memory_profiler의 Occurrences란?
실행 결과에 나오는 Occurrences는 해당 코드 줄이 몇 번 실행되었는지를 보여줍니다. 예를 들어, range(1_000_000)과 같은 반복문이 있는 줄은 수십만~수백만 번 실행되며, 이 정보를 통해 최적화 포인트를 파악할 수 있습니다.
✅ 추가 예제: 파일 읽기 비교
from memory_profiler import profile

@profile
def read_file_list():
    """파일을 list로 읽기"""
    with open('large_file.txt', 'r') as f:
        lines = f.readlines()  # 모든 줄을 메모리에 로드
    return len(lines)

@profile
def read_file_yield():
    """파일을 yield로 읽기"""
    def line_generator():
        with open('large_file.txt', 'r') as f:
            for line in f:
                yield line.strip()

    count = 0
    for _ in line_generator():
        count += 1
    return count
✅ memory_profiler 고급 사용법
1. 특정 함수만 프로파일링
from memory_profiler import profile

@profile
def my_function():
    # 이 함수만 메모리 프로파일링
    pass
2. 라인별 메모리 사용량 확인
from memory_profiler import profile

@profile
def detailed_analysis():
    a = [1, 2, 3]      # Line 1: 메모리 증가
    b = "hello"        # Line 2: 메모리 증가
    c = {1: 'one'}     # Line 3: 메모리 증가
    del a              # Line 4: 메모리 감소
    return b, c
3. 실시간 모니터링
# mprof plot 사용하기 위하여 설치
pip install matplotlib
# 터미널에서 실시간으로 메모리 사용량 모니터링
mprof run your_script.py
mprof plot  # 그래프로 시각화
✅ 성능 최적화 팁
1. 메모리 효율적인 데이터 처리
# ❌ 비효율적
def process_large_data():
    data = [i * 2 for i in range(10_000_000)]  # 모든 데이터를 메모리에 저장
    return sum(data)

# ✅ 효율적
def process_large_data():
    return sum(i * 2 for i in range(10_000_000))  # 제너레이터 사용
2. 파일 처리 최적화
# ❌ 비효율적
def read_large_file():
    with open('large_file.txt', 'r') as f:
        lines = f.readlines()  # 모든 줄을 메모리에 로드
    return [line.strip() for line in lines]

# ✅ 효율적
def read_large_file():
    with open('large_file.txt', 'r') as f:
        for line in f:
            yield line.strip()  # 한 번에 한 줄씩 처리
✅ 주의사항
@profile 데코레이터는 성능에 영향을 줄 수 있습니다
- 프로덕션 코드에서는 제거하거나 조건부로 사용
메모리 프로파일링은 정확하지 않을 수 있습니다
- 가비지 컬렉션 타이밍에 따라 결과가 달라질 수 있음
대용량 데이터 처리 시 주의
- 메모리 부족으로 인한 프로그램 중단 가능성
✅ 결론
- 메모리가 넉넉하다면
list가 빠릅니다. - 하지만 대용량 데이터를 처리하거나 메모리 제한이 있는 환경에서는
yield가 필수입니다. memory_profiler는 코드 성능 최적화 시 매우 유용한 도구입니다.- 적절한 상황에 맞는 데이터 구조 선택이 중요합니다.